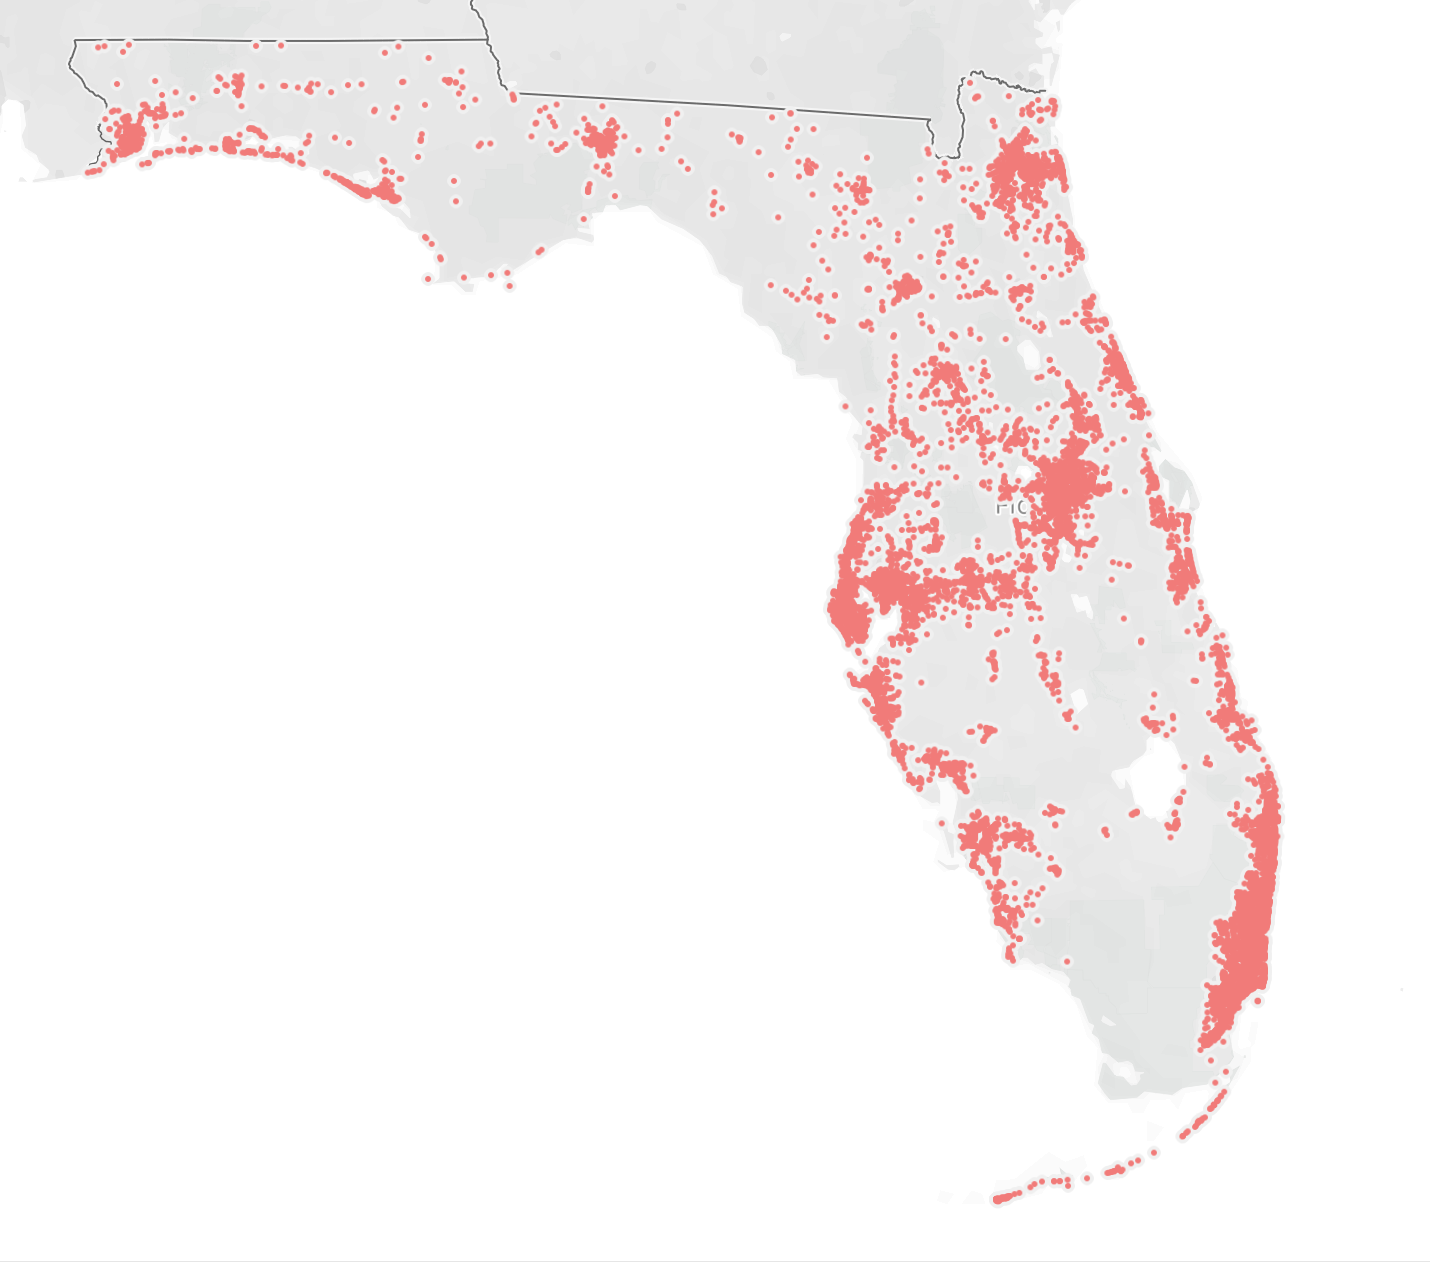
This visual is from the FL Department of Transportation data set on
pedestrian involved traffic incidents from 2011 to 2013. To allow Tableau to recognize the Latitude and Longitude fields, I had to change the fields from 'measures' to 'dimensions'
and assign the correct 'geographic role'.
After considering the Gestalt Laws I believe this visualiztion could be improved to be more communicative. The point visualization is suitable for this type of geographic map, however,
Southeastern and Central areas of Florida are heavily populated with instances of crashes, and appear cluttered without providing much insight. It might be more useful to group to data
by county, and have the point sizes and color be proportional to the number of crashes. This would need to be supplemented with a more detailed view option to zoom into each respective
county and view a more granular look at the accident locations.