This module's assignment called to create my own visualization based on any set of data that appropriately shows the 5 principles of design in a multivariate analysis.
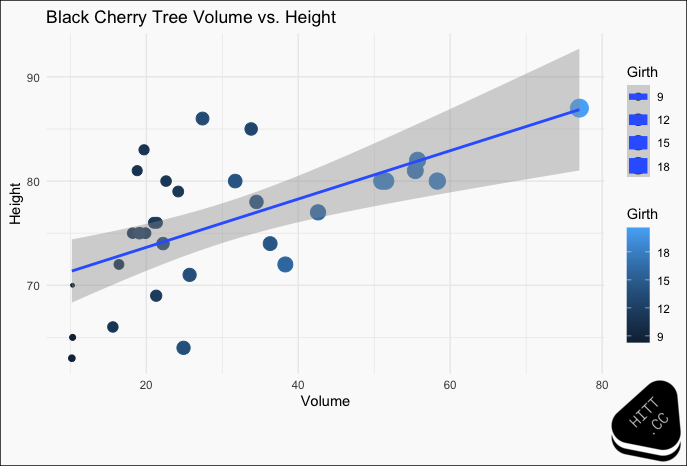
I had some difficulty at first when finding an appropriate data set for two reasons. First, the data had to be multivariate. And second, I wanted a data set which I had not previously used. I settled on the "Girth, Height and Volume for Black Cherry Trees" because the variables present had a clear relationship that was easily visualized.
Multivariate Plot
- Alignment: The purpose of alignment is to create order and organisation among elements. I believe this was achieved in this plot with the mirroring of the title and logo, as well as the centering of the axis titles and legends.
- Repitition: Repition is used to create association and consistency between elements. This was achieved here with the consistency of the color palette and smoothing method. The opportunity to use repitition is greater when considering a portfolio of plots.
- Contrast: Constrast is achieved here with the size of the Girth variable and brightness of the smoothing line.
- Proximity: Proximity means that elements are visually connected in some way. This is achieved by grouping the legends and placing the title and logo on opposite corners.
- Balance: Balance brings stabilization and structure to the plot with the mirroring of the logo and title and centering of the axis labels. Symmetry is difficulty to introduce without altering the form of the graph.